Let me start by sharing a little bit about myself and what motivated me to create my “$2.7 Million Profit System.”
I started my career in construction… working long hours remodeling stores for companies like Home Depot and McDonald’s. I received calls at all hours… with problem after problem to solve.
It required a TON of time away from my family. With several new mouths to feed… all living in a small, 1,200-square-foot house… I decided I needed to take a big risk, quitting my job and getting into trading instead.
At the start, I was terrible at it. I made the same mistakes everyone did.
I was about to give up when I discovered a rare and unusual trading method that altered my life.
The indicator I discovered is the power of “the squeeze.” It’s now become known as the “everyman’s indicator”… and is used by some of the most successful traders in the world.
I call my strategy TPS, which stands for “trend, pattern, squeeze.”
Within the first three years… I used this trading secret to turn $37,000 into over $1 million.
And in the fourth year… I made ANOTHER $1.4 million in profits… just in that one year alone!
It amounted to a grand total of over $2.7 MILLION in profits…
I’ve shared my secrets with thousands of traders from all around the globe.
I’ve spoken at various investor conferences…
And I’ve helped regular people from all walks of life find the best plays in the market to reach their financial goals. In the first 10 months of opening my private trading room, Daily Profits Live, last year… I closed 43 winning trades for 100%-plus gains.
TPS is a proven, three-step method to find the best trades to make consistent winners. Hands down.
But now… I’ve got something new.
Something really BIG.
In addition to my TPS system, which provides members with plenty of chances to make big, quick profits nearly every week, we are adding a brand-new AI-powered trading tool that can automatically scan the market… pinpoint WHAT stocks to trade… and even predict WHEN to get into a trade for BIG gains.
This new AI-powered tool is called the Stock Acceleration Monitor. We call it S.A.M. for short… and it’s the future of trading.
Daily Profits Scanner members have exclusive access to this next-gen AI trading tool.
Let me start with a refresher on how my TPS system works… and what I’m looking for…
The TPS System
My TPS system is at the foundation of my trading strategy, and it has provided the lion’s share of trades I make each week.
Let me break it down for you in more detail.
As I mentioned, TPS stands for “trend, pattern, squeeze”…
Let’s start with trend.
The first thing I look for is a positive trend.
(I will occasionally recommend put options, but I am almost always following bullish stock movements and recommending call options. My TPS system specializes in tracking the flow of money into stocks.)
I closely follow the trend, or flow of money. Consistent buying pressure creates the upward trend I look for.
I want to trade with the trend.
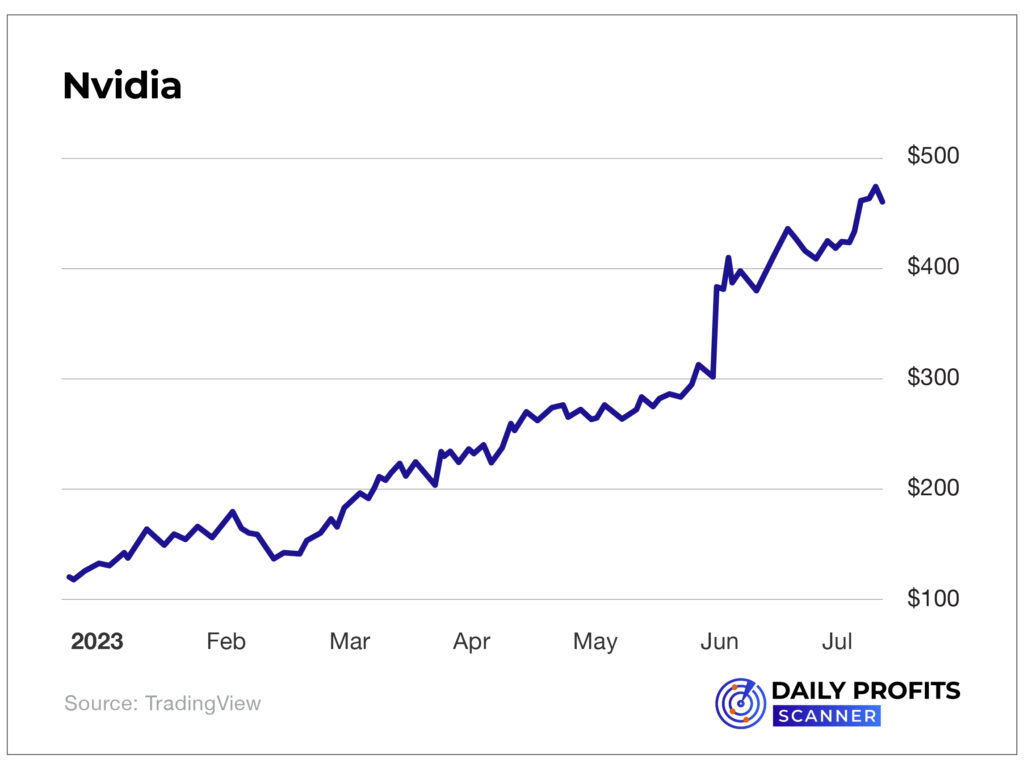
Below is a stock chart for Nvidia (NVDA) from 2023. You’ll notice the stock was in a clear upward trend. The price wasn’t going straight up… but it was achieving higher lows and higher highs. That’s a good indicator that the stock will continue moving higher.
Financial institutions – think big brokerage firms, investment banks and hedge funds – are the big players in the stock market. They’re moving millions or even billions of dollars in and out of stocks based on their analysis.
The institutions making these investments don’t do it overnight…
Depending on the size of their investment, it can take days, weeks or months to establish their position in a stock.
It’s a similar scenario for most individual investors… but for a different reason.
Because the majority of people don’t follow the markets as closely as financial institutions do (or as closely as I do), it may take days or weeks for them to hear about favorable developments or positive news concerning a specific company.
But once individual investors hear the good news… they start buying the stock.
That combined flow of money – from institutions and individuals – into the stock creates the upward trend.
My screening system can show me a variety of trend patterns for the short, medium and long term. And that helps me determine the proper time frames and price targets for my options trades.
Next, we have pattern.
In technical analysis, there are specific chart patterns that have a history of providing a reliable indication of what’s to come.
These chart patterns make up the foundation of technical analysis. You’ve likely heard of some of the unusual names given to these patterns… bull flag, head and shoulders, cup and handle, and double top, to name a few.
These chart patterns can help you understand the best times to buy stocks… when to sell… and when to be patient.
Technical analysts like me spend a lot of time looking for identifiable chart patterns to trade.
Let me give you an example…
I’ll use Nvidia again. It’s a stock I’ve had a lot of success with. The chart below shows Nvidia in a bull flag pattern.
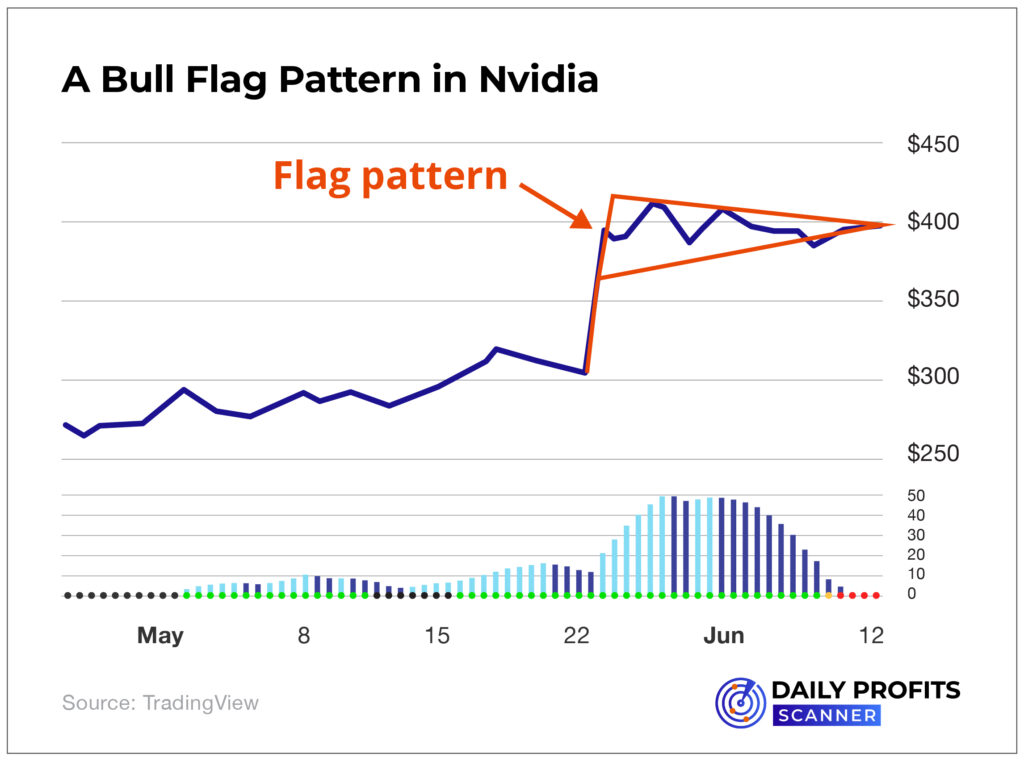
A bull flag pattern is a trend continuation pattern that is seen when a stock has a strong upward rally (the flagpole) followed by a period of consolidation and market indecisiveness (the flag).
In the Encyclopedia of Chart Patterns, the bull flag pattern is ranked No. 1 for signaling when a stock is set to take off…
When the stock breaks through the upper line of the flag (the resistance level), it often results in a powerful move higher. This indicates that bullish investors are again buying the stock after the consolidation in price and volatility.
That leads us to squeeze…
A squeeze is a compression in price and volatility.
Stocks don’t go straight up. An upward trend typically goes up in a stair-step pattern, with the stock “resting” at times before moving higher.
That resting period represents the squeeze.
After a sharp rise in the stock, the squeeze occurs. Volume declines, and the price stabilizes as bullish and bearish investors gauge the situation.
See the red dots in the chart above? That’s the squeeze indicator. Those colorful bars below the price movement essentially represent the frequency of trading.
The red dots along the horizontal line indicate that the stock is “squeezing” out the last bit of consolidation from a period of sideways price action. It signals that another “step” or “leg” in the pattern is about to present itself (either up or down).
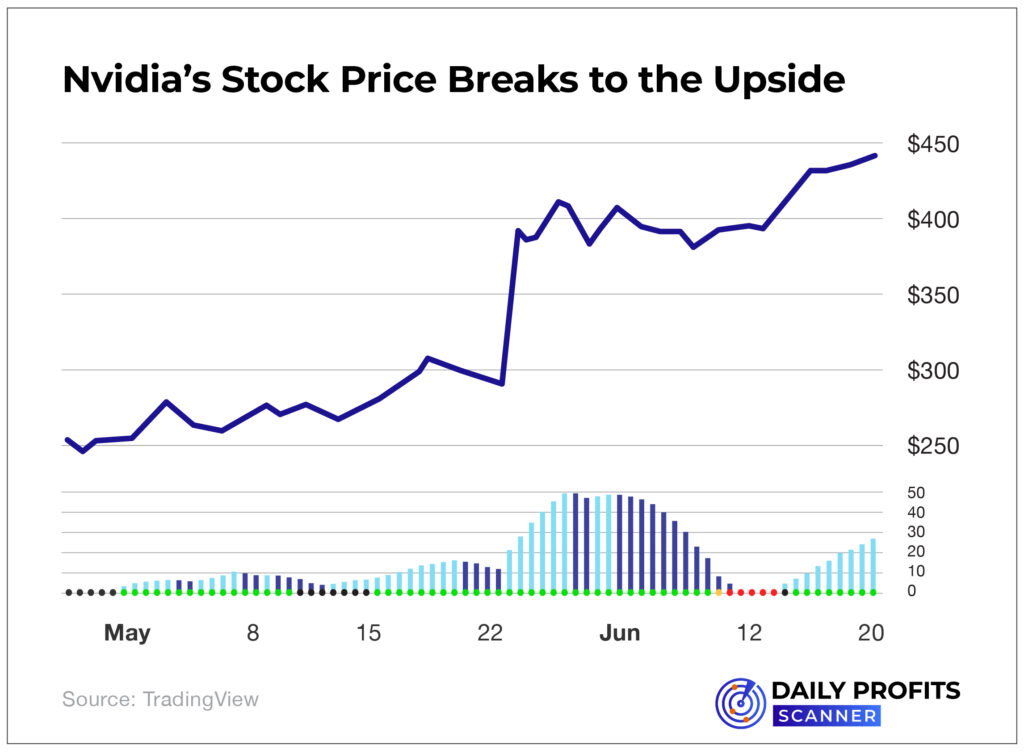
Now take a look at the chart below…
It shows what happened to Nvidia’s stock price after the squeeze occurred and the price broke higher out of the flag pattern.
The stock surged another $50 over the following few weeks…
Investors who bought call options after the initial breakout made a killing!
The squeeze is a very helpful way to identify consolidations and signal when prices are likely to break out.
If the stock price breaks to the upside after the sideways price action, it represents the final signal I’m looking for.
The upward trend is back in motion, the chart pattern is confirmed and buyers are snapping up shares.
When all the indicators of my TPS system are giving me the green light…
It’s time for us to make money!
How to Add Technical Analysis to Your Investing “Toolbox”
For those of you who are interested in diving deeper into technical analysis, there are many free and easy-to-use websites available to you.
In all likelihood, your current brokerage firm offers a variety of free technical analysis capabilities and tutorials.
My favorite site for technical analysis is TradingView. It is the site I use to find trades for my services.
I subscribe to TradingView’s most expensive package so that I have as much information as possible at my disposal. However, for as little as $15 per month, you can get a subscription that provides live data. It includes access to charts showing the squeeze indicator.
TradingView offers a 30-day free trial of its various services. You can go HERE if you want to give it a try. (I have no affiliation with TradingView. I’m simply mentioning this as a potential source for technical analysis tools.)
Now, I love seeing members take home massive profits. And the profit potential is about to get so much bigger. The power of AI is the next step in the evolution of trading…
Using AI to Simplify My TPS Strategy
While my TPS system has worked very well for me and members of my services, it has one big limitation. I’m human.
At the end of the day, I need to analyze charts, market dynamics and numerous other factors on a six-monitor setup.
Using that manual system, I can set up a few hundred trades per year, and some of them are going to be losses. But now, I have S.A.M.
S.A.M. is capable of seeing all the trends and squeezes across all S&P 500 stocks. It can identify which direction a stock is moving and the exact moment when its squeeze begins. It boils all of that data down into a number. The lower that number, the more recent the squeeze. And if the momentum of the stock is trending upward, then there’s our buy signal.
Here’s an example featuring Juniper Networks (JNPR) at the end of 2023…
We can see that the squeeze score in the daily column was 1, meaning the squeeze had just begun.
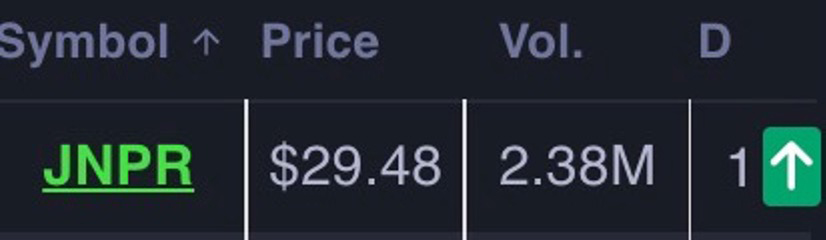
A squeeze score of 1 is great – it means that we have a new squeeze. And right next to this number you see a green arrow…
It reflects that this stock has positive momentum. In other words, it’s heading up. When the arrow turns green, it’s time to buy.
If a stock has a squeeze score of 1 inside the daily column, that tells me the pressure is now releasing and the stock is beginning its upward move.
This is the time to buy.
We want to get into a setup as fast as we can… preferably if the squeeze number is 10 or under.
When this number hits 15 or 20… we’re likely too late.
So we want the number to be low.
In addition, S.A.M. gives investors an opportunity to analyze a chart before buying into a trade. S.A.M. can do it all in one single screen, pinpoint short-term and long-term opportunities, and let you know if you’re looking at a bullish or bearish setup… fast too.
S.A.M. can scan the stock market 5 million times per second. It would take a human years or even decades to look through all of that data just once.
S.A.M. looked at 2023’s market data and located 1,345 potential trades. Of those, 1,068 were winners. The average trade lasted just 10 days and had a win rate of 79.41%.
On average, when backtested, S.A.M. located 1,214 profitable trade setups per year, or about five winners per day.
The results speak for themselves. With S.A.M., we can get even more profit opportunities all year round, in bull or bear markets.
You can read more about S.A.M., how it works and what it does in my report: “Finding FAST Profits TODAY: A Quick-Start Guide to Using the Daily Profits Scanner.”
TPS: A Reliable Profit-Making System – Now With the Power of AI
As you can probably tell by now, I’m a big believer in using chart patterns to get results.
Chart patterns are a visual representation of human emotion in the market – fear and greed.
And humans behave in repeatable patterns that we can see by using charts.
Because of the historical track record of these patterns, I use them to help me determine the direction a particular stock is likely to go.
Not always… but historically, specific, identifiable patterns more often than not have been indicators of what happens next.
This strategy has most certainly worked for me…
Using my TPS system helped me turn $37,000 into $2.7 million!
Now we have AI on our side.
Just to recap, with S.A.M., you can…
- See all of the active squeezes across all S&P 500 stocks and index ETFs…
- See the direction of every stock’s momentum…
- Analyze a stock’s chart before making a trade.
S.A.M. will even suggest three power options contracts to choose from based on your personal risk tolerance.
I want the power of AI to boost investors’ daily profit opportunities on Day 1… Welcome to the Daily Profits Scanner!